
The RSI Peak and Bottom MT4 Indicator is a popular technical indicator used by traders to identify potential buy and sell signals in the forex market.
This indicator is based on the Relative Strength Index (RSI) and is designed to highlight the peaks and bottoms of the RSI line.
Traders can use this information to make informed trading decisions and improve their trading strategy.
The RSI Peak and Bottom Indicator is a versatile tool that can be used on any currency pair and timeframe.
It is easy to use and can be customized to suit the needs of individual traders.
The indicator is available for free download and can be modified to include additional features or settings.
Traders who use the RSI Peak and Bottom Indicator can combine it with other indicators and trading systems to improve their entries and exits.
The indicator can also be used to identify bullish and bearish divergences, which can be used to predict changes in price dynamics.
With its user-friendly interface and customizable settings, the RSI Peak and Bottom Indicator is a valuable tool for traders looking to improve their trading performance.
How to Use RSI Peak and Bottom Mt4 Indicator?
RSI Peak and Bottom MT4 Indicator is a technical indicator that is used to identify potential peaks and bottoms in the price movement of a currency pair.
This indicator is based on the Relative Strength Index (RSI) and is designed to help traders identify potential reversals in the market.
Installation and Modification
To use the RSI Peak and Bottom MT4 Indicator, traders first need to download and install it on their trading platform.
The indicator is available for free download from various online sources.
Once downloaded, traders can install it by following the instructions provided.
After installation, traders can modify the settings of the indicator to suit their trading style and preferences.
The indicator allows traders to set the RSI period, the number of bars to look back, and the threshold for identifying peaks and bottoms.
Signal Generation
The RSI Peak and Bottom MT4 Indicator generates signals based on the peaks and bottoms identified by the indicator.
When the RSI value crosses the threshold set by the trader, the indicator generates a signal indicating a potential reversal in the market.
Traders can use these signals to enter or exit trades, depending on their trading systems and strategies.
It is important to note that the RSI Peak and Bottom MT4 Indicator is a lagging indicator and should be used in conjunction with other technical indicators and price action analysis.
In summary, the RSI Peak and Bottom MT4 Indicator is a useful tool for traders looking to identify potential reversals in the market.
Traders can download and install the indicator for free and modify its settings to suit their trading style.
The indicator generates signals based on the peaks and bottoms identified by the indicator, which traders can use to enter or exit trades.
RSI Peak and Bottom Mt4 Indicator Trading Strategy
The RSI Peak and Bottom MT4 Indicator is a popular technical analysis tool that can help traders identify potential trend reversals.
This section will discuss some of the most common trading strategies that can be used with this indicator.
Bullish Divergence Strategy
One common strategy for using the RSI Peak and Bottom MT4 Indicator is to look for bullish divergences.
This occurs when the price of an asset makes a lower low, but the RSI indicator makes a higher low.
This can be a sign that the downtrend is losing momentum and that a bullish reversal may be imminent.
Traders can use this signal to place a buy order, with a stop loss set at the recent low.
Take profit targets can be set at key resistance levels or based on other technical analysis tools.
Bearish Divergence Strategy
Conversely, traders can also look for bearish divergences using the RSI Peak and Bottom MT4 Indicator.
This occurs when the price of an asset makes a higher high, but the RSI indicator makes a lower high.
This can be a sign that the uptrend is losing momentum and that a bearish reversal may be imminent.
Traders can use this signal to place a sell order, with a stop loss set at the recent high.
Take profit targets can be set at key support levels or based on other technical analysis tools.
Reversal Price Action Strategy
Another strategy that can be used with the RSI Peak and Bottom MT4 Indicator is to look for reversal price action signals.
This can include bullish or bearish engulfing patterns, pin bars, or other candlestick patterns that indicate a potential reversal.
Traders can use these signals in combination with the RSI indicator to confirm the reversal and place trades accordingly.
Combining with Other Indicators
Finally, traders can also combine the RSI Peak and Bottom MT4 Indicator with other technical analysis tools to generate more accurate signals.
This can include trend lines, moving averages, or other oscillators.
By using multiple indicators in combination, traders can increase their confidence in their trading signals and make more informed trading decisions.
Overall, the RSI Peak and Bottom MT4 Indicator can be a valuable tool for traders looking to identify potential trend reversals.
By using it in combination with other technical analysis tools and following a clear trading strategy, traders can improve their chances of success in the forex market.
Tips for Using RSI Peak and Bottom Mt4 Indicator
When using the RSI Peak and Bottom Mt4 Indicator, there are several tips that traders should keep in mind to ensure they get the most out of the tool.
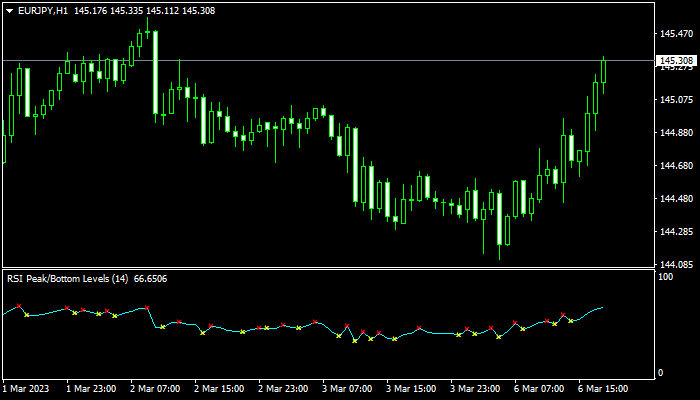
Firstly, it is important to understand that the RSI line runs from zero to 100.
The indicator provides traders with a visual representation of the highs and lows of the RSI line, marked with red “X” and blue “X” respectively. These marks can be used to identify potential entry and exit points.
Traders should also pay attention to the bullish and bearish reversal price action, which can be identified using the RSI Peak and Bottom Mt4 Indicator.
When the RSI line crosses the 70 level and then starts to move downwards, this is a bearish reversal signal.
Conversely, when the RSI line crosses the 30 level and starts to move upwards, this is a bullish reversal signal.
When using the RSI Peak and Bottom Mt4 Indicator, it is important to modify the settings to suit the trader’s preferred forex trading system.
This includes selecting the appropriate currency pairs and timeframes, as well as adjusting the settings of other forex indicators being used.
Traders can also benefit from using the RSI Peak and Bottom Mt4 Indicator in conjunction with other technical analysis tools, such as support and resistance levels, trendlines, and moving averages.
Overall, the RSI Peak and Bottom Mt4 Indicator can be a valuable tool for traders looking to identify potential entry and exit points in the forex market.
By following these tips and incorporating the indicator into a well-rounded trading strategy, traders can increase their chances of success.
Download Now

I’m Mino, a forex trader with years of hands-on experience and a knack for market trends. My mission? To guide you through the complexities of forex trading and help you reach your financial aspirations. With personalized strategies and proven insights, I’ve empowered countless traders to navigate the markets confidently and achieve steady profits. Join me on the path to financial success in forex trading!
Don't Miss Pro Indicators and Trading Systems